Plastic waste is a growing issue in this enclosed ecosystem we call Earth. As landfills grow, we must forgo our single-use mentality and embrace recycling to create a more responsible plastic economy. Identification of plastic types for separation is key to effective recycling, and Raman spectroscopy offers the speed and specificity to help.
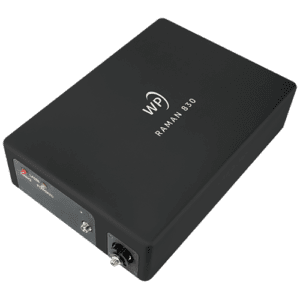
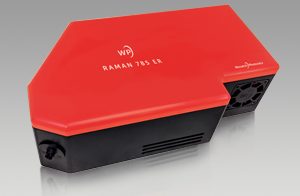
In this application we talk about how to do Plastic identification with Raman Spectroscopy. We’ll introduce the WP 785 ER extended range Raman spectrometer as the ideal tool to discriminate between plastic types, due to its spectral range well beyond the fingerprint region, its high sensitivity and signal to noise ratio (SNR), and excellent reproducibility.
 We’ll show the ability of this extended range Raman spectrometer to identify the chemical nature of plastic items down to the exact variety within some of the more diverse polymer families, and the presence of additives. Raman’s narrow line width, high sensitivity to non-polar bonds, and low sensitivity to water and common inorganic fillers makes the technique ideally suited for this application. In fact, its unsurpassed specificity in this task, combined with the speed and accuracy of the WP 785 ER, may be just the right combination to bring plastic ID technology to life.
A global problem
Plastic is a ubiquitous and highly versatile material; it’s hard to imagine life today without it. The rise of plastic as a mass-produced product did not start until the 1960s, but within just 20 years plastic had surpassed steel as the most widely used material worldwide. Plastic is a designer material like no other – available in a wide variety of form factors, easily colored or made transparent, and low in cost. The majority of plastic, however, is produced for single-use items, like the 78 million tons of plastic packaging manufactured every year – a third of which ends up in the ocean (one garbage truck every minute). At the current rate, this amount will double by 2030.
 The heightened awareness of this global plastic waste problem and the increased scrutiny of the corresponding industry practices has created an enormous opportunity for more sustainable approaches to create a responsible plastic economy. Besides a fundamental shift towards viewing plastics as a valuable, high-quality, designer material, this change also calls for radically improved recycling economics and quality.
Due to the detrimental effects of mixing different types of plastics, recycled post-consumer plastic waste not only needs to be clean and colorless, but also of high chemical purity to compete with virgin material. Raman spectroscopy comes to the rescue on all three accounts: by identifying the type of polymer in the waste stream, detecting residual contamination, and spotting the presence of dyes. While this has been demonstrated using the fingerprint region of polymer spectra (to 2000 cm-1), we’ll show how extended range and superior sensitivity, reproducibility, and SNR can ensure highly accurate plastic ID at speeds practical for industrial use.
Reduce. Recycle. Raman.
To demonstrate the capabilities of Raman spectroscopy to distinguish specific plastic types, we recorded Raman spectra from a variety of everyday plastic items composed of 10 of the most common plastic material types, using them to develop a model for identification of plastic type based on Raman spectroscopy.
The 38 plastic samples measured included plastic containers, bottles, goggles, syringes, tubing, films, bags, tapes, ties, and foam. This ensured inclusion of the most common plastic or polymer types, including polyamide (PA), polycarbonate (PC), polyethylene (PE), polyester (PET), poly-methylmethacrylate (PMMA), polypropylene (PP), polystyrene (PS), polytetrafluoroethylene (PTFE), polyurethane (PU), polyvinylchloride (PVC). In addition to known plastics with clear markings and reliable chemical provenance, we included a few unmarked ‘unknowns’ to verify that our algorithms would correctly reject those as failing to match approved, standard recyclable categories.
Measurements were taken with the WP 785 ER, a high performance, extended range high-throughput spectrometer configured with a temperature-regulated detector and 25 µm slit, covering a spectral range from 200 to 3500 cm-1 with 9 cm-1 resolution. A 785 nm, 300 mW laser was used to excite the Raman emission, with routing of light to and from the sample via an RP 785 fiber-coupled Raman probe . A 105 µm, 0.22 NA routed laser light to the probe, and a 600 µm, 0.39 NA fiber matched to the spectrometer collected scattered light. Spectra are recorded with an integration time of 200 ms without averaging. A total of 20 spectra were recorded at 4 different locations on each item.
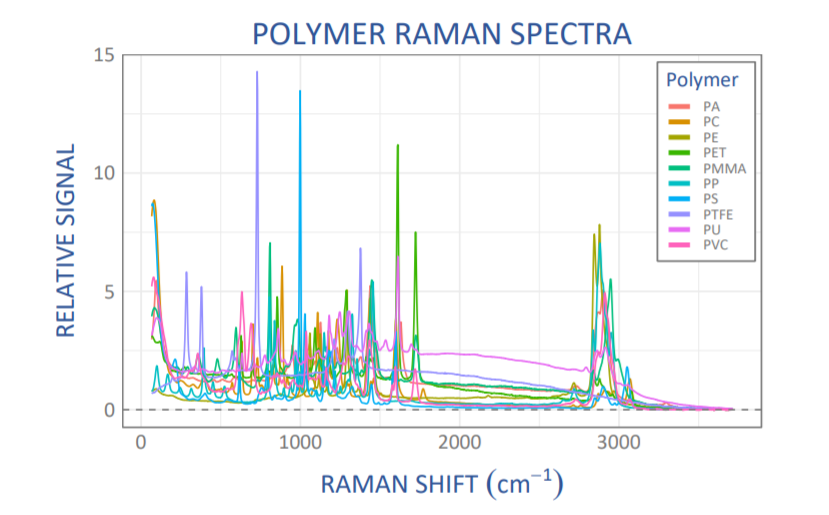
Figure 1: Comparison of Raman spectra for individual samples made of different polymer types. The signal is (SNV-) scaled for better comparison. PA = polyamide, PC = polycarbonate, PE = polyethylene, PET = polyester, PMMA = poly-methylmethacrylate, PP = polypropylene, PS = polystyrene, PTFE = polytetrafluoroethylene, PU = polyurethane, PVC = polyvinylchloride.
Due to the high resolution of the extended-range spectrometer, the recorded Raman spectra are very feature-rich, as shown by the comparison of individual sample spectra made of different polymer materials in Figure 1. Despite the rapid acquisition time of just 200 ms, the spectra were also very high quality and showed no discernable noise. High spectral quality and signal to noise (SNR) is essential to achieve high confidence in polymer identification, while high speed is crucial to the throughput of sorting systems used in recycling facilities.
First steps in analysis – ‘plastically’ different
As the first step in analysis, we calculated the first derivative of each spectrum. Looking at the first derivative of a spectrum draws out its key features and accentuates small differences between nearly identical spectra. It can be used to find exact peak locations, which appear as zero-crossings in the first derivative. Peak widths in the original spectrum translate into peak height in the first derivative, with narrower peaks showing larger amplitudes in the first derivative. Use of the first derivative in analysis also helps correct for background signal and facilitates multicomponent analysis. Differentiation and smoothing are often combined into a single algorithm such as a Savitzky-Golay filter for best results.
In this case, we calculated the first derivative of each spectrum using a second order Savitzky-Golay filter, oversampling slightly with a 9-point window to remove any broadband fluorescent background. We then scaled the derivative spectra to a standard normal variate to remove any signal variation due to differences in the sample-probe distance.
Numerical differentiation, as a high-pass filter, tends to amplify noise and is therefore often avoided in favor of ad-hoc background subtraction using smooth fits. However, thanks to the high signal-to-noise ratio in the present spectra, we could avoid such fits and take the preferred derivative route, yielding high-quality, background-free spectra.
High Reproducibility
For polymers with high chemical uniformity, such as polystyrene, we found excellent reproducibility of the spectra from sample to sample, as well as from location to location as shown in Figure 2. This was despite considerable differences in their form, even though this diverse group included boxes, a petri dish, and the center from a roll of tape. Such reproducibility is paramount to reach high confidence in any spectral matching application, and indicative of the excellent wavelength stability of the WP 785 ER spectrometer employed.
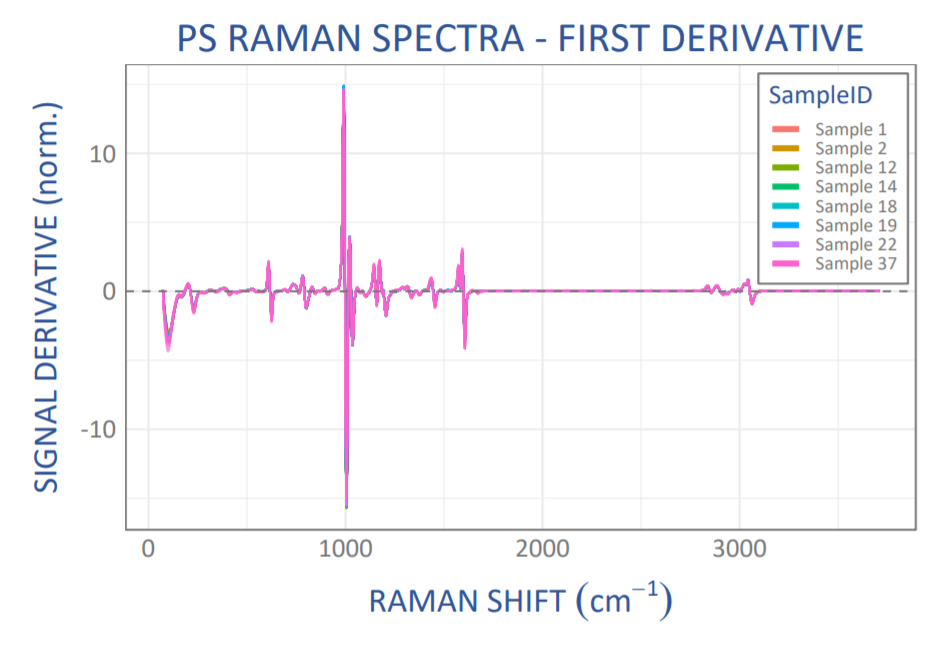
Figure 2: Scaled derivative Raman spectra from 8 different polystyrene (PS) samples (20 spectra each), showing excellent spectrum-to-spectrum reproducibility.
High Specificity
An additional benefit of the excellent spectral reproducibility observed from the WP 785 ER data of polymers was the ability to distinguish even minor differences between spectra with the confidence that those differences are (statistically) significant. As an example, Figure 3 shows scaled derivative Raman spectra for two different polyamide (Nylon) samples. Different types of Nylon exist with varying numbers of carbon atoms in the links between the amide groups, leading to slight differences in the spectra, for example around 950 cm-1.
Given the excellent sample to sample spectral reproducibility shown in Figure 2, we can be confident that the minor differences between first derivative spectra seen in Figure 3 are significant, and can thus assign these two samples to two different types of Nylon.
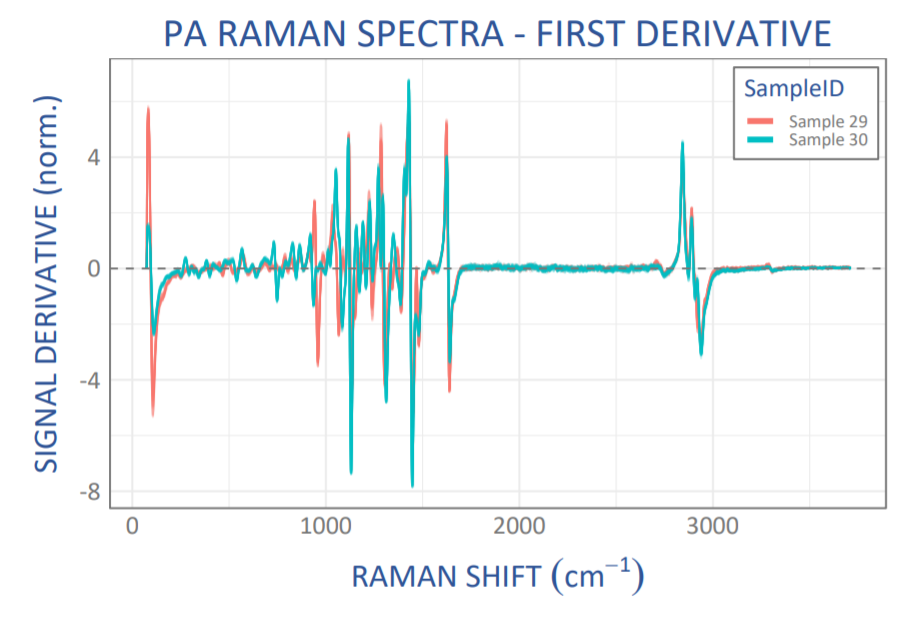
Figure 3: Scaled derivative Raman spectra from 2 different polyamide (PA) samples (20 spectra each) showing the high specificity, and clearly resolving even small spectral differences.
Identifying the culprits
Once confident that spectral quality was high and differences between spectra significant, we moved on to analysis, using statistical methods to look for correlations in the data and perform matching of spectral data against a library. Principal component analysis, for example, allows us to visualize the reproducibility, similarities, and differences between the Raman spectra of different polymer samples within the entire set of recorded spectra. In this case, the principal components captured significant signal contributions up to at least 15th order, which again is testimony to the very high signal quality and information content of the Raman spectra collected. Figure 4 shows a score plot for the first two principal components, illustrating a clear distinction between different polymers, as well as the significance of any potential differences within a polymer group (for example PA).
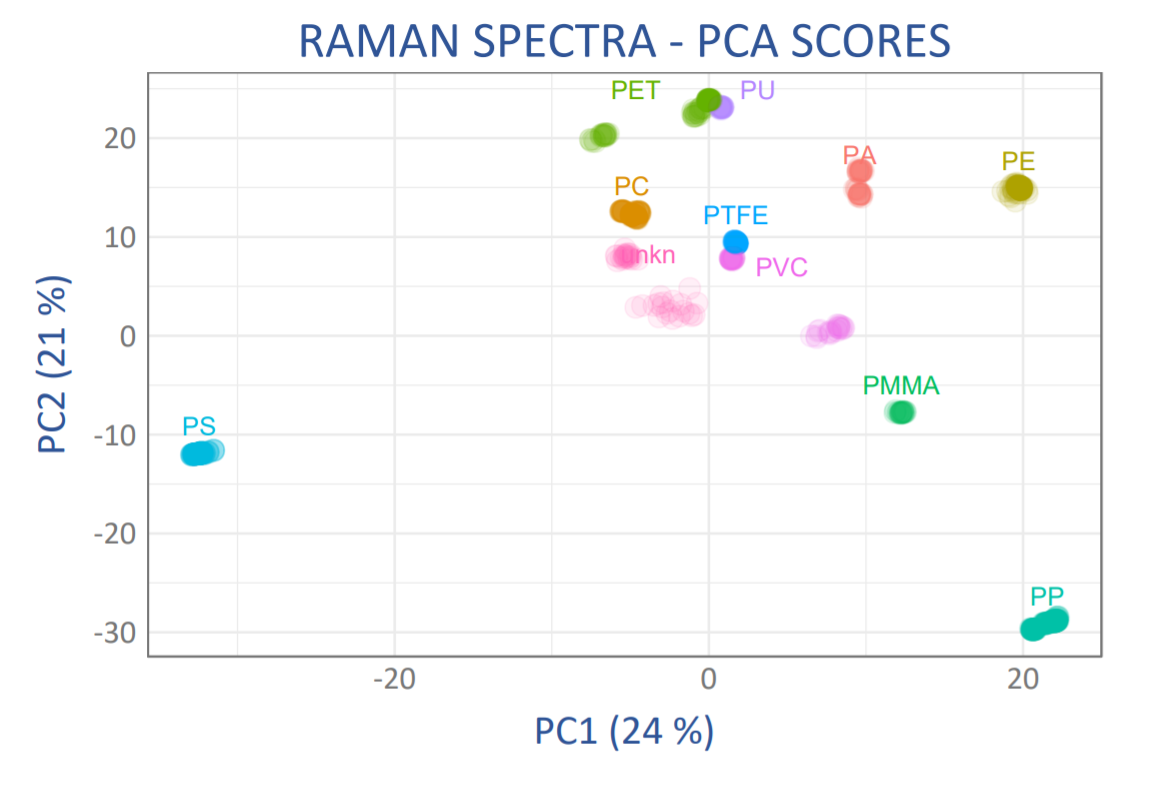 Figure 4: Scores plot for the first two principal components for the scaled derivative Raman spectra for all samples showing the high reproducibility and specificity of the spectra. Polymer abbreviations as in Figure 2, “unkn” = two samples of unknown polymer type.
Tight clustering indicates that the principal components selected are significant and appropriate for the identification of materials with a given group. Measurement of a subsequent unknown which overlaps with one of these groups can then be reasonably assigned to that material type. Having highly reproducible spectra from sample to sample and location to location makes it much easier to do so reliably.
In our study of plastics, two polymer groups which are known to vary in their composition due to manufacturing practices showed more than one region of clustering, as would be expected: 1) the PVC group included vinyls with different plasticizer, and 2) the PET group included polyester (just one variant in this family of polymers which includes Mylar®). In contrast, chemically unambiguous polymers, such as polystyrene (PS), led to well defined, tight clusters, indicating both the applicability of Raman spectroscopy to identification of plastics, and also the high quality of the data used in this particular study – a direct result of the performance of the WP 785 ER.
Matchmaking Polymers & Plastics
Qualitative PCA plot interpretation notwithstanding, the identification of a specific plastic or polymer type for high-quality recycling requires the statistical matching of a recorded Raman spectrum against a library of reference Raman spectra. To test the suitability of the present Raman system configuration for this application, we determined spectral matching using a slightly different statistical method, Pearson’s correlation coefficient, r2, a measure of the linear correlation between two variables X and Y. In this case, Pearson’s correlation coefficient looked at the correlation between the scaled derivative Raman spectra for a given sample and all spectra in a library constructed from all remaining samples with known polymer identity, that is, in “leave-one-out” (LOO) cross-validation.
Using derivative spectra focuses the matching algorithm on the edges of the vibrational bands and yields intrinsically high sensitivity to even slight spectral differences between any two spectra. This in turn, however, also requires excellent wavelength stability of the spectrometer, a hallmark of the Wasatch Photonics spectrometer design.
We determined the combined confidence for both accepted and rejected matches using a cross-entropy (log-loss) function summed over all library spectra, yielding a numerical measure which we interpret as the total uncertainty in the match. This numerical measure penalizes any wrong assignments, as well as low confidence in all correct assignments or rejections. A low score (uncertainty) indicates a correct and confident assignment, the numerical value of which can be understood as the negative logarithm of the overall confidence; for example, an assigned uncertainty of 0.05 corresponds to an overall matching confidence of 90% (-log(0.9) is about 0.05). The overall matching confidence varies dramatically by polymer type, as shown in Figure 5.
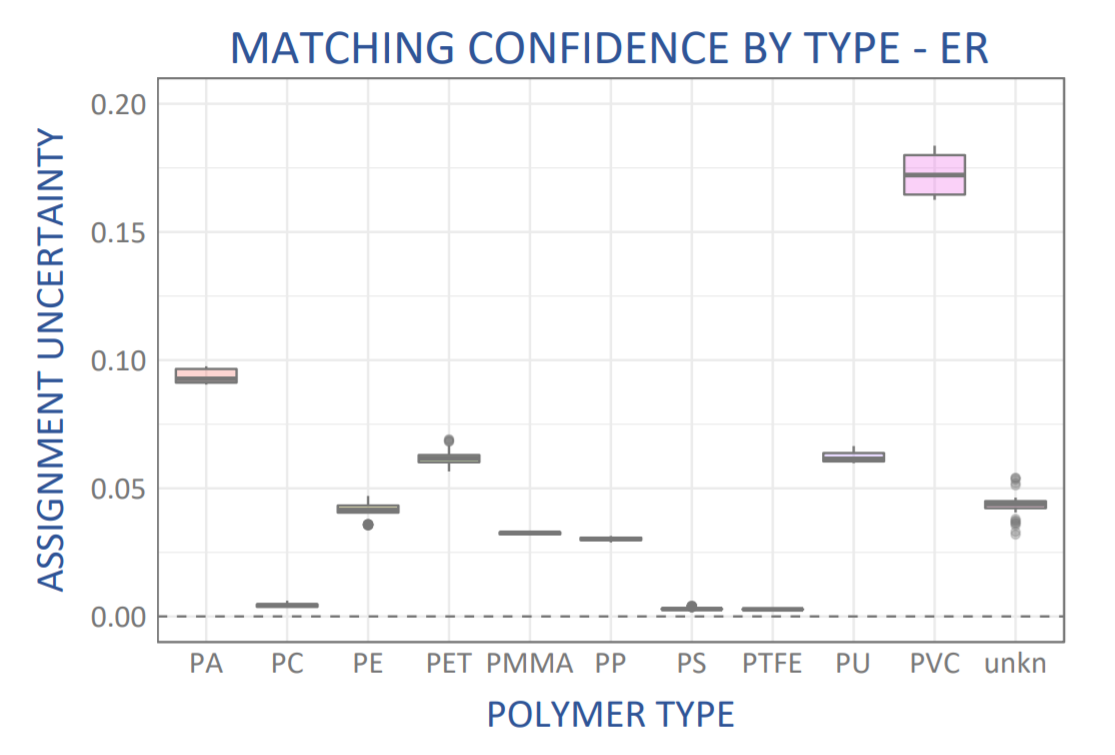
Figure 5: Assignment uncertainty for the match of each sample spectrum against a “leave-one-out” library constructed from the remaining sample spectra of known polymer type. PA = polyamide, PC = polycarbonate, PE = polyethylene, PET = polyester, PMMA = poly-methylmethacrylate, PP = polypropylene, PS = polystyrene, PTFE = polytetrafluoroethylene, PU = polyurethane, PVC = polyvinylchloride.
The polymer types with the largest uncertainty were those known to have chemical variation within their families (PA and PVC), as discussed above. All other polymer types showed >86% confidence in matching; those with unambiguous chemical structure, such as PC, PS, and PTFE yielded exceptionally high confidence in the spectral match, >98.5%.
The case for extended range – the best gets better
The spectra recorded and analyzed above were taken over the extended spectral range of the WP 785 ER, from 200 cm-1 to 3500 cm-1, although conventional wisdom would posit that only the fingerprint region to 2000 cm-1 is needed for identification applications. Would a more limited range suffice for plastics identification?
When working in a real-world recycling environment, the fingerprint region might be overwhelmed with signals from sample contaminations, increasing the importance of the less-crowded high-frequency stretching vibrations beyond 2000 cm-1. In addition, some common polymers, such as ABS, which was not part of the present sample set, feature characteristic vibrations in this region.
To test the significance of using extended range spectral acquisition, we repeated the analysis above once more, but using truncated spectra. We again determined the polymer matching performance following the same methodology, but limited the upper end of the spectrum to 2000 cm-1 to simulate analysis using only the fingerprint region. The impact on polymer matching confidence due to the additional information available in the extended spectral range is illustrated in Figure 6.
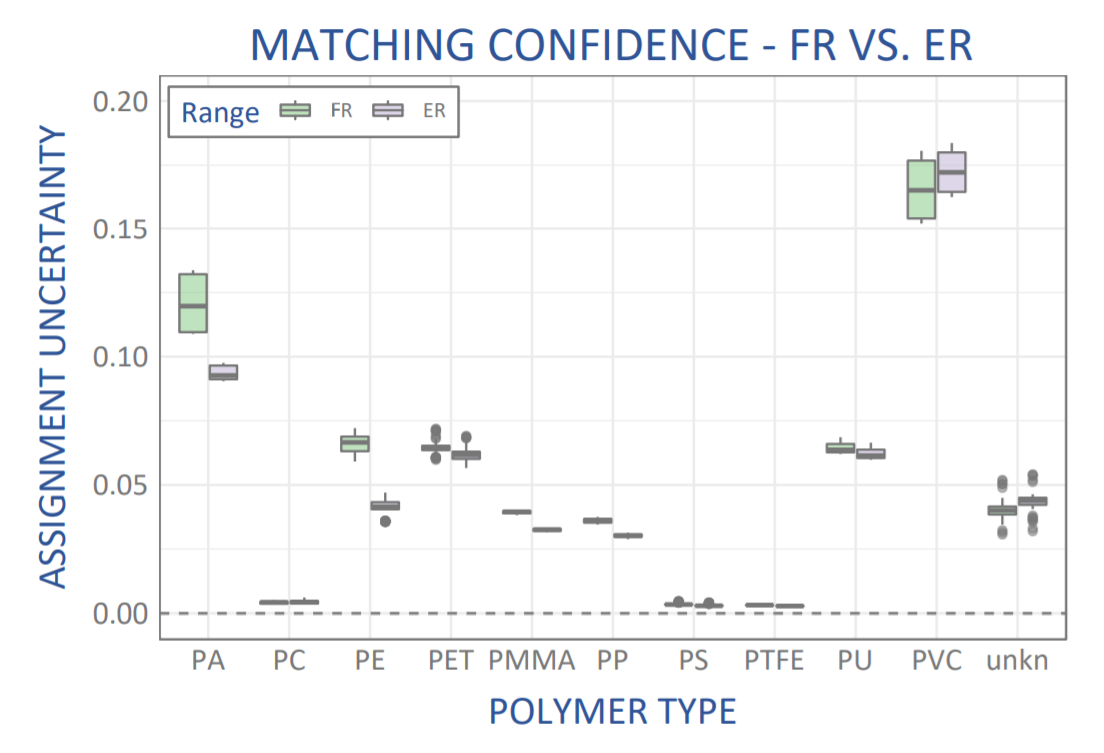
Figure 6: Comparison of matching confidence for plastics identification using spectral data over the fingerprint range to 2000 cm-1 (FR, green) vs an extended range to 3500 cm-1 (ER, grey).
Even for the non-contaminated samples used in the present study, we noticed a (statistically) significant improvement for most polymer types, with an increase in matching confidence between 10 and 25% for most polymer types. Polyethylene showed the largest improvement in confidence; the matching uncertainty is almost cut in half. With a chemical structure that only features C-H and C-C bonds, the polyethylene vibrational spectrum is sparse in the fingerprint region, but features a prominent CH-stretch peak around 3000 cm-1, which most likely leads to this marked improvement in matching confidence. The improvement in matching confidence for these 10 polymers as a group validates the benefit of using extended range for the identification of plastic types in recycling, even when the spectra used in each case is highly reproducible, and with excellent SNR.
Conclusion
So, did we succeed to do plastic identification with Raman Spectroscopy? The answer is yes! Raman spectroscopy is a powerful tool for the identification of plastic types with very high specificity, as demonstrated by our analysis of common household and laboratory items with the new WP 785 ER extended range Raman spectrometer. Even at scan rates of just 200 ms, the spectra collected offered excellent SNR and reproducibility, facilitating development of a library of 10 polymer spectra against which plastics could be matched to confidently identify the exact type of polymer used, even when limited to the fingerprint region (as in our standard range WP 785 spectrometer). When the full range of the WP 785 ER to 3500 cm-1 was used in library development and analysis, the matching confidence increased even further for the common recyclable plastics tested, validating the suitability of this new spectrometer as a promising tool for increasingly accurate polymer identification in high throughput sorting for recycling of plastics. Which just goes to show – even the best gets better with more data.
Thank you for reading.
#Raman #Wasatch #785 #plastic #recycling #spectroscopy