Spices such as turmeric are one of the most commonly adulterated foods. Their high value makes even a small dilution with fillers financially worthwhile, and when sold in ground form, easy to disguise. Spectroscopy offers the potential to provide testing of spices in the field at reasonable cost, reducing the dependence on remote lab analysis and facilitating immediate validation of purity and authenticity. UV-VIS spectroscopy is one such option, enabled by our WP UV-VIS spectrometer covering 250-850 nm.
The golden history and benefits of turmeric
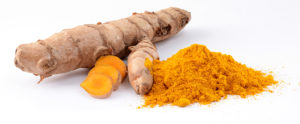 Turmeric holds a unique place in both cooking and medicine, and can be traced back over a thousand years in India and China – some even say that it was used ten thousand years when Lord Rama walked the Earth. This bright orange-yellow spice grows as a root, and though related to ginger, it carries its own heady fragrance, and earthy taste with notes of citrusy bitterness and spicy pepper. It gains its color and many of its medicinal properties from the compound curcumin, though it contains other pharmacologically relevant compounds such as curcuminoids and turmerone.
Turmeric has gained tremendous popularity in Western naturopathic medicine due to its anti-inflammatory, anticarcinogenic, antioxidant, and wound-healing effects. Many sufferers of arthritis and migraines take as much as one tablespoon of turmeric or curcumin supplement daily for management of their conditions. Early research studies also suggest that curcumin may boost the effects of chemotherapy, while turmerone promotes repair in the stem cells of the brain and may help to improve memory in Alzheimer’s patients.
Hazards of adulteration
With so many potential health benefits driving up both value and demand, adulteration of turmeric is becoming more common than ever. Fillers such as saw dust, rice flour, chalk powder or starch may be added, which though they may not be toxic, serve to dilute the medicinal strength of the powder. Microscopy allows the identification of starch molecules within the powder, as does UV-VIS reflectance spectroscopy.
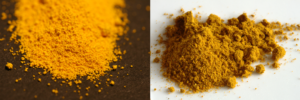
The stakes become more serious when dyes or colorants are used to intensify the yellow color of the ground powder after dilution. These may include toxic lead chromate and cadmium, or more commonly metanil yellow. Metanil yellow (C18H14N3NaO3S) is a toxic azo dye that behaves like a carcinogen if used over a prolonged period of time (as in daily consumption for health benefits). Reports include testicular, bladder, and kidney cancers. In 2013, the FDA issued a recall on the PRAN brand of turmeric powder from stores in five US states due to lead levels as high as 28 and 42 parts per million (candy has a maximum level of 0.1 parts per million).
Testing at home & in the lab
Home-based methods for assessing the quality and authenticity of turmeric abound, from procedures involving concentrated hydrochloric acid to “stir & settle” tests. Definitive testing requires a validated analytical such as liquid chromatography, capillary electrophoresis, or micellar chromatographic methods – all of which are expensive and complex to perform. Spectral methods are emerging as alternatives, including the use of FT-IR for detection of metanil yellow down to 5% concentration, and FT-Raman down to 1% concentration. Terahertz spectroscopy has even been proposed as a through-packaging method to effectively and non-invasively identify adulteration of turmeric with chalk powder.
Going lower in detection – to the UV!
UV-VIS absorbance spectroscopy offers a much lower cost option for authentication of spices, and is already the industry standard for saffron (ISO 3632 governs its testing). Turmeric is no exception, exhibiting a signature broad absorbance peak at ~425 nm due to curcumin, as well as a shorter secondary peak at ~250 nm. As a test of our WP UV-VIS spectrometer, we looked at two concentrations of turmeric dissolved in ethanol, collecting data from ~240 nm through 850 nm with 2 nm resolution at an integration time of 18 ms.
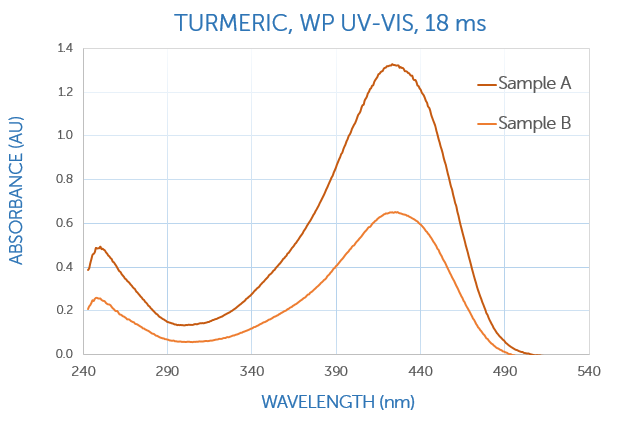
Both characteristic peaks were clearly seen, with excellent signal to noise ratio (SNR) over the full spectral range, and most notably at the UV wavelengths, where SNR tends to degrade. Absorbance values measured spanned 0.6 AU to 1.3 AU, scaling empirically with concentration.
 The WP UV-VIS spectrometer covers 250-850 nm, with resolution as low as 2.5 nm. With linear absorbance from 0.1 – 3.7 AU at 300 nm, its performance rivals many high-end, analytical bench UV-VIS systems at a fraction of the size and cost. To learn more about how we deliver greater sensitivity, shorter integration times, and lower detection limits, read our tech note, Why Wasatch for Spectroscopy.
This application note is written by Wasatch Photonics
References
- Dhakal, Sagar, et al. “Evaluation of turmeric powder adulterated with metanil yellow using FT-Raman and FT-IR spectroscopy.” Foods 5.2 (2016): 36.
- Subhan, M. A., et al. “Synthesis and Characterization of Metal Complexes Containing Curcumin (C 21 H 20 O 6) and Study of their Anti-microbial Activities and DNA-binding Properties.” Journal of Scientific Research 6.1 (2013): 97-109.
- Nong, Hoang, et al. “Fabrication and vibration characterization of curcumin extracted from turmeric (Curcuma longa) rhizomes of the northern Vietnam.” SpringerPlus 5.1 (2016): 1147.
- 10 Health Benefits and Uses for Turmeric Curcumin Supplements, www.cognitune.com, July 4, 2018.
Thank you for reading
#UVVIS #spectroscopy #food #reflection #anticounterfeir #Wasatch